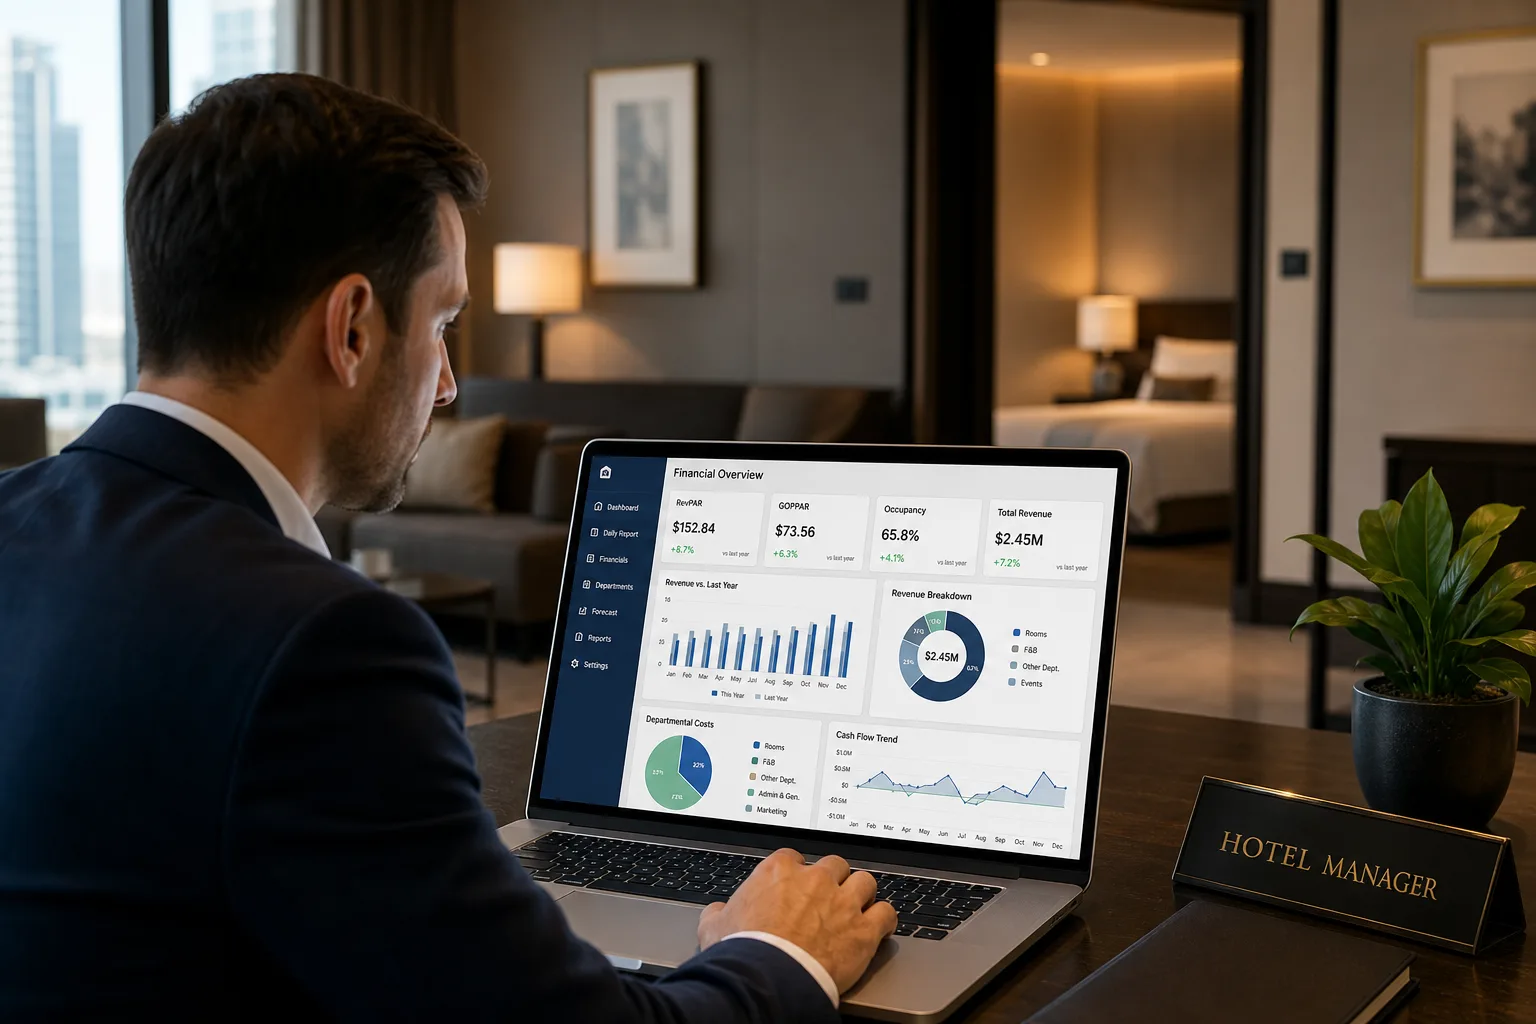
In a hospitality market where competition and guest expectations rise year after year, success no longer depends on the guest experience alone. The smooth operation, efficiency and profitability of a hotel rest on the continuous measurement and analysis of its operational indicators. Monitoring these hotel metrics is the essential tool for any tourism professional who wants to turn data into strategic decisions.
TL;DR
- Every hotel needs a small, clearly defined set of KPIs; without them, management cannot see where profit is being made or lost, or whether services are priced correctly.
- Five indicators form the core: occupancy rate, ADR, RevPAR, GOP and guest satisfaction. Together they cover demand, pricing, revenue efficiency, profit and the guest’s own verdict.
- The value lies in interpretation and action, not collection: hotels that use KPIs consistently in decision-making see RevPAR rise 8–15%, operating costs fall by up to 10% and GOP margin improve by 5–7 percentage points within 3–6 months.
Why every hotel needs its own KPIs
Hotel KPIs, key performance indicators, act as a compass for management. They give a clear picture of how the hotel’s operations are performing and support decisions that are documented rather than intuitive.
A hotel without clearly defined KPIs runs three specific risks:
- Losing profit without noticing. When results are only reviewed as an annual total, leaks in cost or revenue are discovered long after they could have been fixed.
- Over- or under-pricing its services. Without reliable data on rate, occupancy and cost, the price of a room, a package or a service is set by habit or by copying the neighbour, and either leaves money on the table or drives guests away.
- Not understanding its true costs. A hotel that cannot state what a night in a room costs to service cannot know whether any given booking is actually profitable.
“Its own” KPIs is the operative phrase. Indicators should reflect the hotel’s category, business model and objectives. A seasonal resort, a city business hotel and a boutique guesthouse will weigh the same metrics differently and set different targets, even if the underlying formulas are identical.
The indicators you cannot afford to ignore
Five indicators form the foundation of hotel performance management. Each answers a different question, and they are far more powerful read together than in isolation.
| KPI | Formula | The question it answers |
|---|---|---|
| Occupancy rate | Rooms sold ÷ Rooms available × 100 | How much demand are we capturing? |
| ADR (average daily rate) | Rooms revenue ÷ Rooms sold | What price are we achieving per sold room? |
| RevPAR (revenue per available room) | Rooms revenue ÷ Rooms available, or ADR × Occupancy | How efficiently is the whole inventory generating revenue? |
| GOP (gross operating profit) | Total revenue − Operating expenses | Is the operation actually making money? |
| Guest satisfaction score | Review ratings, survey scores, NPS | Will guests return and recommend us? |
Occupancy rate
Occupancy is the most immediate indicator of demand: the share of available rooms actually sold in a given period. On its own it says nothing about profitability, since a full hotel at a give-away rate can be a losing one. Its real strength emerges when it is combined with historical data. Tracking occupancy by day, week and segment against prior years sharpens booking forecasts, which in turn drives better staffing, purchasing and pricing decisions.
ADR (average daily rate)
ADR shows the average price achieved per sold room, and it is the ideal measure for pricing strategy. Rising ADR at stable occupancy means pricing power is growing; falling ADR at rising occupancy may mean the hotel is buying volume with discounts. Tracking ADR by room type, channel and segment reveals where rate is strong and where it is being eroded, for example by heavy dependence on discounted OTA traffic.
RevPAR (revenue per available room)
RevPAR combines occupancy and rate into a single figure and therefore reflects real revenue efficiency. It settles the eternal argument between “fill the rooms” and “hold the rate”: whichever combination produces the higher RevPAR is generating more revenue from the same inventory. Because it is measured per available room rather than per sold room, RevPAR is also the fairest way to compare performance across periods, or against competitors, with different occupancy levels.
GOP (gross operating profit)
GOP reflects overall operating profitability: what remains from total revenue after departmental and undistributed operating expenses are paid, before fixed charges such as rent, financing and depreciation. It is the indicator that determines whether the business is “working for the owner or working for the expenses”. Revenue KPIs tell you how much money is coming in; GOP tells you how much of it stays. Expressed as GOP margin, a percentage of total revenue, it is the single most honest measure of how well the hotel is run.
Guest satisfaction score
Satisfaction is the emotional indicator, but it is no less critical for that. A high score means repeat guests, positive reviews and stronger direct demand; a low score eventually shows up in every other KPI, first in reputation, then in ADR and occupancy. Whether measured through online review ratings, post-stay surveys or Net Promoter Score, satisfaction should sit on the same dashboard as the financial metrics, not in a separate report that only the front office reads.
How sound KPI analysis improves operational efficiency
The value of indicators lies not in collecting them but in interpreting and using them. A spreadsheet full of numbers that nobody acts on is decoration. A hotel that analyses its metrics systematically can do four things that others cannot.
Identify weak periods and adjust rates
Occupancy and pick-up data reveal soft dates weeks in advance. That is the window in which yield management works: adjusting rates, opening targeted offers or building value-added packages while there is still time to influence demand, rather than discounting in panic at the last minute.
Detect and remove unnecessary operating costs
When cost lines are tracked against occupancy and revenue, the ones that are out of proportion become visible. Removing or reducing them, whether in labour scheduling, energy consumption, supplies or maintenance, improves GOP directly, without the need to sell a single extra room.
Monitor guest satisfaction and improve service
Reading satisfaction scores alongside operational data pinpoints the cause of complaints: a dip in housekeeping scores that coincides with a cut in shifts, or breakfast ratings that fall when a supplier changes. That connection allows service improvements to be targeted rather than general.
Set realistic targets for each department
Departmental KPIs give housekeeping, F&B and reception each a measurable goal they can influence: cost per occupied room, CoGS percentage, check-in satisfaction, upsell revenue. Realistic targets grounded in the hotel’s own data are far more motivating, and far more achievable, than a single top-line number handed down from ownership.
Continuous monitoring of these elements leads to better operational efficiency and greater competitiveness in the market.
Reading KPIs together, not separately
The most common mistake in hotel reporting is to look at each indicator in isolation. The insight comes from the combinations:
| What you see | What it usually means | What to look at next |
|---|---|---|
| Occupancy up, ADR down, RevPAR flat | Volume bought with discounts | Channel mix, promotion depth, segment shift |
| RevPAR up, GOP flat or down | Revenue growth being consumed by cost | Labour cost, energy, CoGS by department |
| High satisfaction, low ADR | Underpriced product | Competitive positioning, rate strategy |
| Falling satisfaction, stable financials | Future demand at risk | Staffing levels, maintenance backlog, service standards |
Each row is a decision waiting to be made. A hotel that reviews its KPIs in this way is managing the business; one that files them is merely recording it.
A consultant’s advice
Experience shows that hotels which implement a simple but consistent KPI measurement system see, within 3–6 months:
- An increase in RevPAR of 8–15%
- A reduction in operating costs of up to 10%
- An improvement in GOP margin of 5–7 percentage points
Two words in that sentence matter more than the numbers: simple and consistent. The system does not need dozens of indicators or expensive software. It needs the right handful of metrics, produced on the same basis every week and every month, and reviewed by people with the authority to act on them.
These results are achieved only when data is used systematically in decision-making, and not merely to produce reports. The gap between hotels that measure and hotels that improve is closed entirely by that habit.
Getting started: a practical sequence
For a hotel that is not yet managing by KPIs, the path is straightforward:
- Choose the core five (occupancy, ADR, RevPAR, GOP, guest satisfaction) and define exactly how each is calculated, so that every month is comparable with the last.
- Establish the baseline from the last one to two years of PMS, accounting and review data.
- Set departmental targets that are realistic against that baseline and against the hotel’s positioning.
- Build one dashboard that shows the financial and satisfaction indicators together, updated at least weekly in season.
- Hold a regular review in which deviations are explained and decisions are recorded, so that the numbers drive action rather than discussion.
Conclusion
Measuring operational indicators is not a bureaucratic obligation. It is the tool that transforms a hotel into an organised, efficient and profitable business. Occupancy, ADR, RevPAR, GOP and guest satisfaction, read together and acted upon, tell management exactly where the hotel stands and what to do next.
If you want to learn how to implement and monitor the right KPIs for your own hotel, the first step is deciding to let the data work for you.
How Hotelia360 helps
Hotelia360 turns KPI theory into a live operating system for your hotel: our BI dashboards bring occupancy, ADR, RevPAR, GOP, GOPPAR, departmental costs and guest satisfaction into one view, drawn directly from your PMS, channel manager and accounting data, while our AI agents watch for deviations and recommend the pricing, cost and service actions that move the numbers. It is the consistent, decision-driven measurement discipline described above, delivered without adding to your team’s workload.
Published by Hotelia360, Heraklion. Also available in Greek.