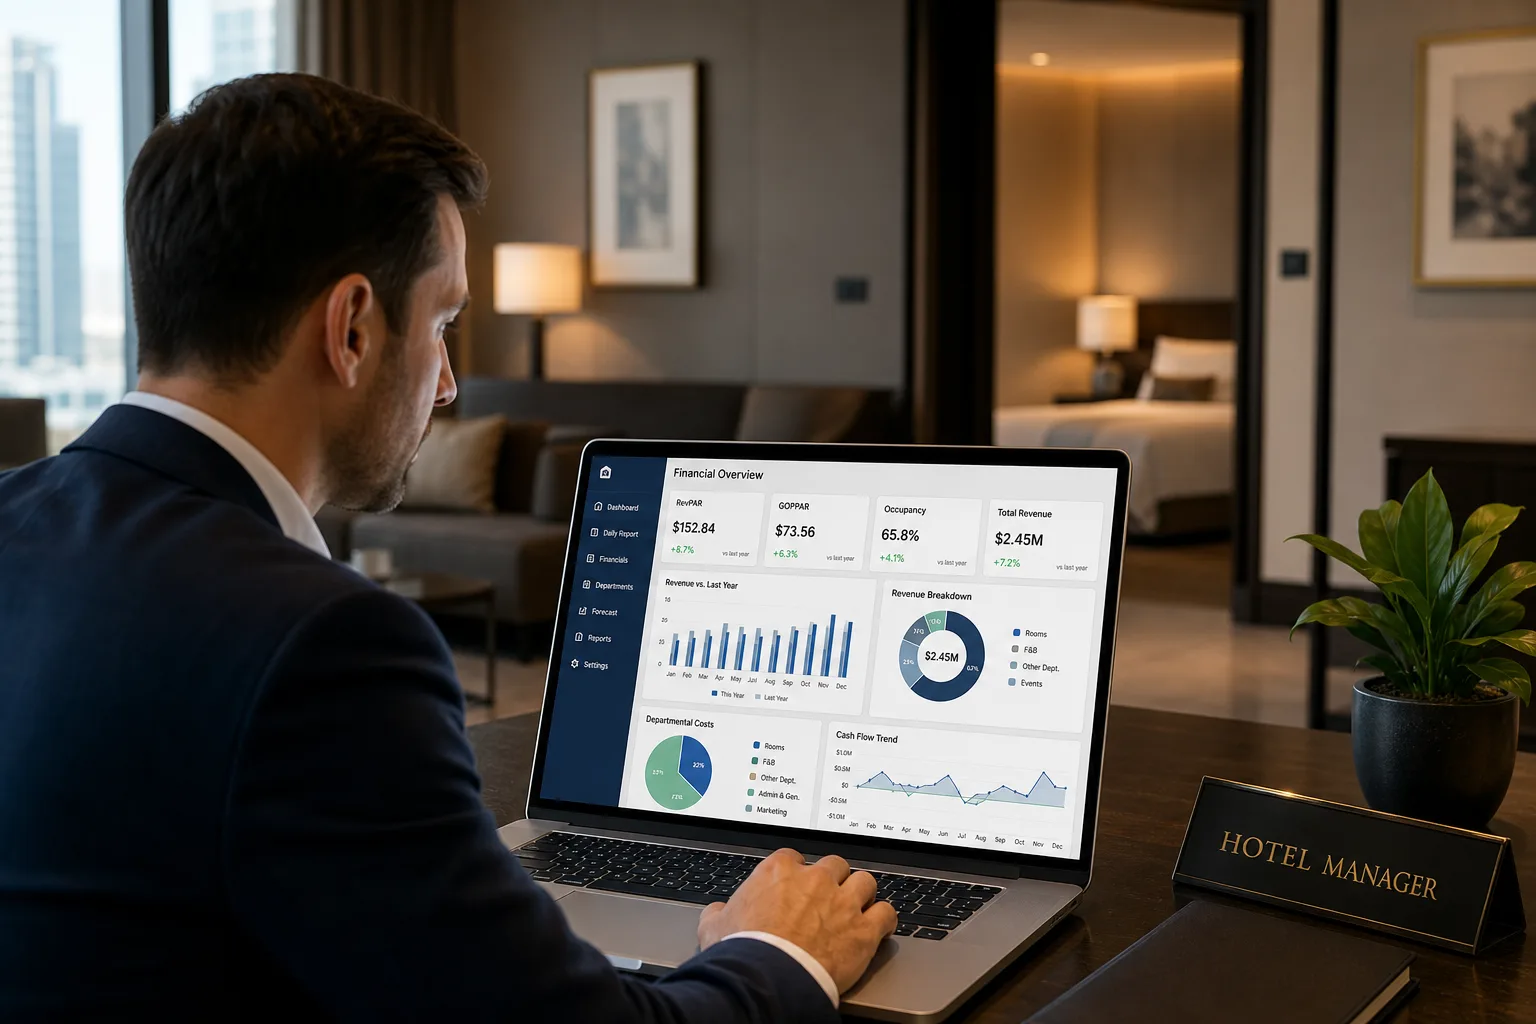
People are the heart of hospitality. They are also, in most hotels, one of the largest operating costs on the P&L. Yet many managers still see HR as a staffing function: recruit, roster, pay, repeat. In reality, the HR department sits on one of the richest sources of strategic data in the building. Read properly, HR data shows exactly where time, resources and money are leaking out of the operation – and how to bring it back to a higher level of efficiency and profitability.
TL;DR
- Your PMS, HRM and time-and-attendance systems already record who worked, when, at what cost and with what output. That is decision-grade data, not paperwork.
- Three ratios do most of the work: revenue per employee, labour cost ratio and a staff productivity index that ties headcount to occupancy.
- The payoff comes from action: occupancy-based rostering, department-level cost analysis, tighter payroll and overtime control, and a direct link between HR planning and revenue forecasts.
From human resources to human data
Modern hotel systems capture a remarkable amount of information about every employee, every shift and every department. A typical property with a PMS, an HRM platform and a time-and-attendance system is already logging:
- Working hours and attendance
- Productivity per shift
- Cost per position
- Training, appraisal and performance records
- Staff satisfaction levels
None of this is bureaucracy. It is a set of decision tools.
When you analyse these records together, patterns emerge that are invisible from the rota alone. You can see which roles genuinely drive output, which ones cost disproportionately more than they return, and where the operation needs a different allocation of people, reinforcement or additional training. The shift is from managing people by feel to managing the operation with evidence.
The HR KPIs every hotel should track
Three indicators give a hotel manager or financial controller a fast, honest read on how efficiently the team is converting labour into revenue.
| KPI | Formula | What it tells you |
|---|---|---|
| Revenue per employee | Total revenue ÷ number of employees | How much revenue each team member generates on average |
| Labour cost ratio | (Labour cost ÷ total revenue) × 100 | What share of revenue is consumed by payroll |
| Staff productivity index | Occupancy, room count and operational demand set against available staff | How well headcount is matched to actual workload |
Revenue per employee
Revenue per employee shows how much revenue, on average, each member of staff produces:
Revenue per employee = Total revenue ÷ Number of employees
Track it over time rather than as a single snapshot. A falling trend is a signal, not a verdict: it may mean tasks need to be redistributed, that part of the team needs retraining, or simply that staffing levels were planned for a demand pattern that no longer exists. The point is that the decline becomes visible early, while there is still time to respond.
Labour cost ratio
The labour cost ratio measures the cost of staff as a percentage of total revenue:
Labour cost ratio = (Labour cost ÷ Total revenue) × 100
This is the ratio that connects HR to the P&L. It tells the hotel manager and the financial controller whether labour cost is staying at a healthy level relative to the hotel’s actual performance – not relative to last year’s budget or to a rule of thumb. When revenue moves and payroll does not, this ratio is where the problem shows first.
Staff productivity index
The staff productivity index combines occupancy, number of rooms, operational requirements and available staff to show how efficiently the team is operating as a whole. It answers a simple question: are we carrying the right number of people for the business we actually have tonight, this week, this month?
The more balanced the index, the more efficient the operation. A hotel that is understaffed will see it in guest reviews and overtime; a hotel that is overstaffed will see it in the labour cost ratio and GOP. The productivity index is the early warning for both.
How HR data improves day-to-day operations
HR analytics moves a hotel from empirical, instinct-led management to operating on real figures. In practice, that looks like:
- Rostering to occupancy, not to habit. Shifts are planned against forecast arrivals, departures and in-house guests rather than against a fixed weekly template.
- Monitoring hours through the systems you already own. PMS, HRM or time-and-attendance data replaces manual timesheets and the guesswork that comes with them.
- Analysing cost by department. Housekeeping, F&B and Reception each have their own cost profile and their own productivity drivers; a single blended payroll figure hides all of them.
- Allocating staff to demand. Moving people between outlets, floors or shifts as demand shifts, instead of holding fixed teams in each area.
- Evaluating performance on targets, data and feedback rather than on impressions.
A worked example: the silent margin squeeze
Suppose occupancy falls by 15%, but labour cost stays flat. The labour cost ratio rises – and profitability declines without anyone noticing immediately, because the payroll number itself has not changed.
Put simple figures on it. If a hotel had €100,000 of monthly revenue and a €30,000 payroll, its labour cost ratio was 30%. If revenue drops roughly in line with occupancy to €85,000 and payroll remains at €30,000, the ratio climbs to just over 35%. Nothing in the payroll report looks wrong, yet five points of margin have quietly disappeared.
With proper monitoring of HR data, the manager sees the ratio move within days and can adjust shifts, headcount and the operating plan before the profit is lost, rather than discovering it in the month-end P&L.
Department by department: where HR data pays off
The three ratios above are property-level. The decisions, however, are made in departments, and each department has its own drivers.
Housekeeping is the most directly occupancy-driven cost in the hotel. The useful numbers are rooms cleaned per attendant per shift and minutes per room, split between stay-overs and departures. Set against tomorrow’s departures and arrivals from the PMS, they tell the executive housekeeper exactly how many attendants to roster – and expose the days when a full team was scheduled for a half-full house.
Food & Beverage labour has to be read alongside F&B revenue and CoGS, not alongside rooms. Covers per server, labour cost as a share of outlet revenue and the gap between forecast and actual covers show whether the restaurant is staffed for the guests actually in the house or for the menu the chef would like to run.
Reception cost follows the arrival and departure pattern, not total occupancy. A property with heavy Saturday turnover and quiet mid-week days needs a very different front-desk roster from one with steady seven-night stays, even at identical occupancy. HR data lets you see the pattern and staff to it.
Staff satisfaction and turnover belong in the same analysis. Where satisfaction scores fall and turnover rises in a specific department, the cost shows up months later as recruitment, training and service inconsistency. Tracking it by department turns a vague morale problem into a specific, fixable one.
From data to action
The value of HR data lies not in collecting it but in using it. Every report should lead to a practical decision that improves efficiency or removes unnecessary cost. The most common wins are:
- Lower turnover through a better employee experience – because recruiting and training a replacement is one of the most expensive things a hotel does.
- Higher productivity through data-driven scheduling.
- More accurate payroll and overtime control, with anomalies caught before they are paid.
- Linking HR to revenue management and booking forecasts, so staffing decisions are made with the same demand picture the revenue team is working from.
- Better preparation for peak periods, with training, cross-skilling and recruitment timed to the forecast rather than to the crisis.
HR is not simply a cost. It is an investment with a return – provided it is measured and managed properly.
Building the habit: a simple operating rhythm
Data only changes behaviour if someone looks at it on a schedule. A practical cadence for most independent hotels:
| Frequency | What to review | Who |
|---|---|---|
| Daily | Hours worked vs. rostered, overtime, occupancy for the next 7 days | Department heads |
| Weekly | Labour cost ratio by department, productivity index vs. forecast | Hotel manager |
| Monthly | Revenue per employee, turnover, training and appraisal status, variance to budget | Management and financial controller |
The review itself need not take long. What matters is that labour decisions are made with the same discipline as pricing decisions, using the same demand data.
Conclusion
In modern hospitality, success does not depend only on guests. It depends on how you manage the people who serve them.
HR data is the hidden lever for any hotel that wants to reduce cost, raise productivity and build a team that operates with precision and autonomy. When you understand the numbers behind your people, you understand the real strength of your business – and where it can still grow.
How Hotelia360 helps
Hotelia360’s live profitability monitoring brings labour cost into the same dashboard as revenue, occupancy and GOP, so a rising labour cost ratio is flagged the week it happens rather than at month-end. Our AI agents connect HR and payroll data with your PMS forecasts to recommend staffing levels by department, and our BI reporting gives owners and managers a single view of revenue per employee, CPAR and GOPPAR across the property.
Published by Hotelia360, Heraklion. Also available in Greek.